When a system breaks downs or malfunctions, finding the cause can often be tricky. This is why BlueMind 3.5.9 integrates a full (open-source) platform metrics, alerting and viewing stack
A BlueMind system — or any email server in general — is extremely complex. It is made up of many components with very specific yet sometimes obscure roles. When the system breaks down or malfunctions, it is often very difficult to find the cause.
Email system breakdowns typically triggers a panic because it is a critical service for most users. Emergency measures are taken, often involving system reboots which (sometimes) solves the problem but will make the post-mortem analysis particularly difficult.
What happens now
A BlueMind system, made up of many services and Java virtual machines, usually tries not to die quietly.
You will find:
• /var/log/java_pid1234.hprof files; memory dumps automatically
generated when the system faces a memory shortage.
• Log files — many of them – where you will find very ugly things such as elastiscsearch
indexes saying “disk high watermark reached, disabling shards” i.e. the hard disk
is full.
In any case, the issue isn’t addressed immediately and a reboot or a disk clean-up are made before any anomaly is reported for analysis.
Letting a hard disk fill up when you’re managing a system isn’t a good idea. You’ll end up with the following situation: the system administrator will clean up the hard disk and then report an anomaly indicating that the search doesn’t work anymore.

This white lie may be an issue, but what we’re really interested in is preventing this from happening in the first place.
Monitoring
Monitoring systems do exist, but until now, they had to be deployed by the people monitoring the BlueMind install. Monitoring Java systems is complicated and general metrics are neither relevant nor revealing.
With BlueMind 3.5.9, we’ve integrated a full stack of metrics, alerting and platform status visualisation.
Open source being our raison d’être, we decided to turn to an open-source solution for this: TICK stack (Telegraf, Influxdb, Chronograf, Kapacitor) http://influxdata.com. A Telegraf agent is installed on each node of your installation. Telegraf collects and sends metrics to Influxdb, Kapacitor crunches them into actionable alerts and Chronograf displays the information to help anticipate problems.
Our integration
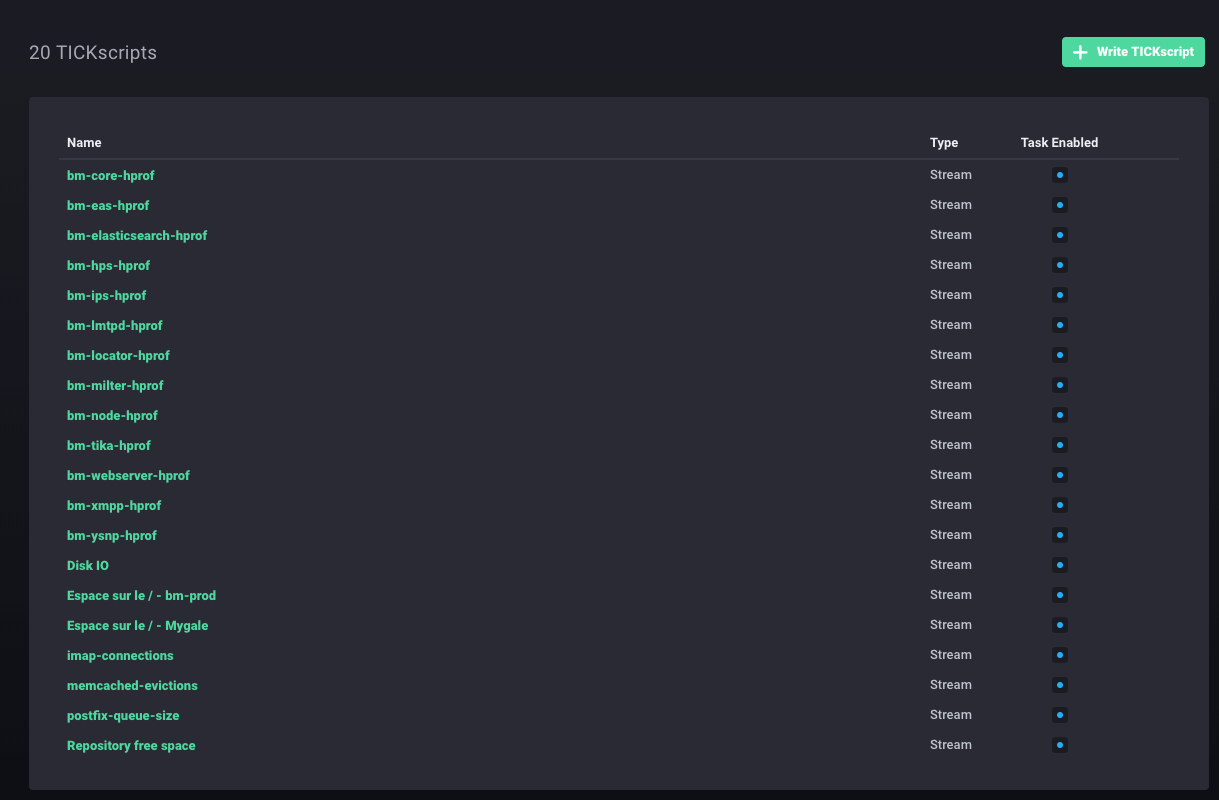
With BlueMind 3.5.9, the whole stack is available but it isn’t deployed by default. You have to install the bm-tick-full package on your server – your main server with bm-core or a dedicated monitoring server.
The bm-tick-full package deploys the whole TICK stack – which is built into our repository to monitor the versions used. You must install bm-tick-node on every server of your BlueMind install. If you do this before updating to v.3.5.9, the update wizard will take care of everything. Otherwise, it is best to restart and force-reconfigure the entire stack from your bm-core server:
curl -H “X-Bm-ApiKey: $(cat /etc/bm/bm-core.tok)” -XPOST http://localhost:8090/internal-api/tick/mgmt/_reconfigure
Java Agent
Some administrators might have noticed that BlueMind’s Java processes run with an additional option:
/usr/lib/jvm/bm-jdk/bin/java -Dlogback.configurationFile=/etc/bm/local/bm-core.log.xml -Dio.netty.native.workdir=/var/lib/bm-core/work -Xloggc:/var/log/garbage-collector/bm-core/gc.pause.log -XX:+UseGCLogFileRotation -XX:NumberOfGCLogFiles=4 -XX:GCLogFileSize=4M -XX:+PrintGCApplicationStoppedTime -server -Xms812m -Xmx812m -Xss256k -XX:+UseCompressedOops -XX:MaxDirectMemorySize=812m -XX:+UseG1GC -XX:MaxGCPauseMillis=500 -XX:+HeapDumpOnOutOfMemoryError -XX:HeapDumpPath=/var/log -Djava.net.preferIPv4Stack=true -Dnet.bluemind.property.product=bm-core -javaagent:/var/lib/bm-metrics-agent/bm-metrics-agent.jar -Djava.awt.headless=true -Dosgi.noShutdown=true -Duser.timezone=GMT -cp /usr/share/bm-core/plugins/org.eclipse.equinox.launcher_1.3.201.v20161025-1711.jar org.eclipse.equinox.launcher.Main -registryMultiLanguage -debug -application net.bluemind.application.launcher.coreLauncher
This agent, which is attached to your virtual machines, allows you to expose application metrics to Telegraf. What does it do?
It opens one unix socket for every JVM in /var/run/bm-metrics:
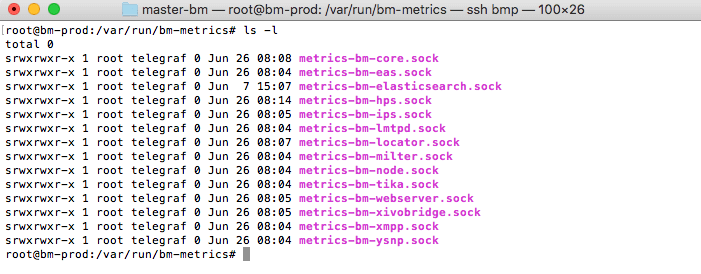
Telegraf queries these unix sockets to get metrics for each component:
curl –unix-socket /var/run/bm-metrics/metrics-bm-lmtpd.sock http://bm/metrics
Which returns — as a simplified version:
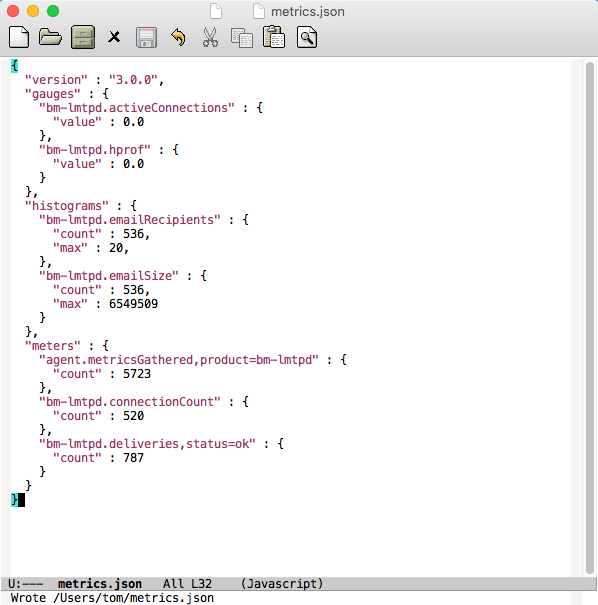
This data is consumed by Telegraf every 10 seconds and…
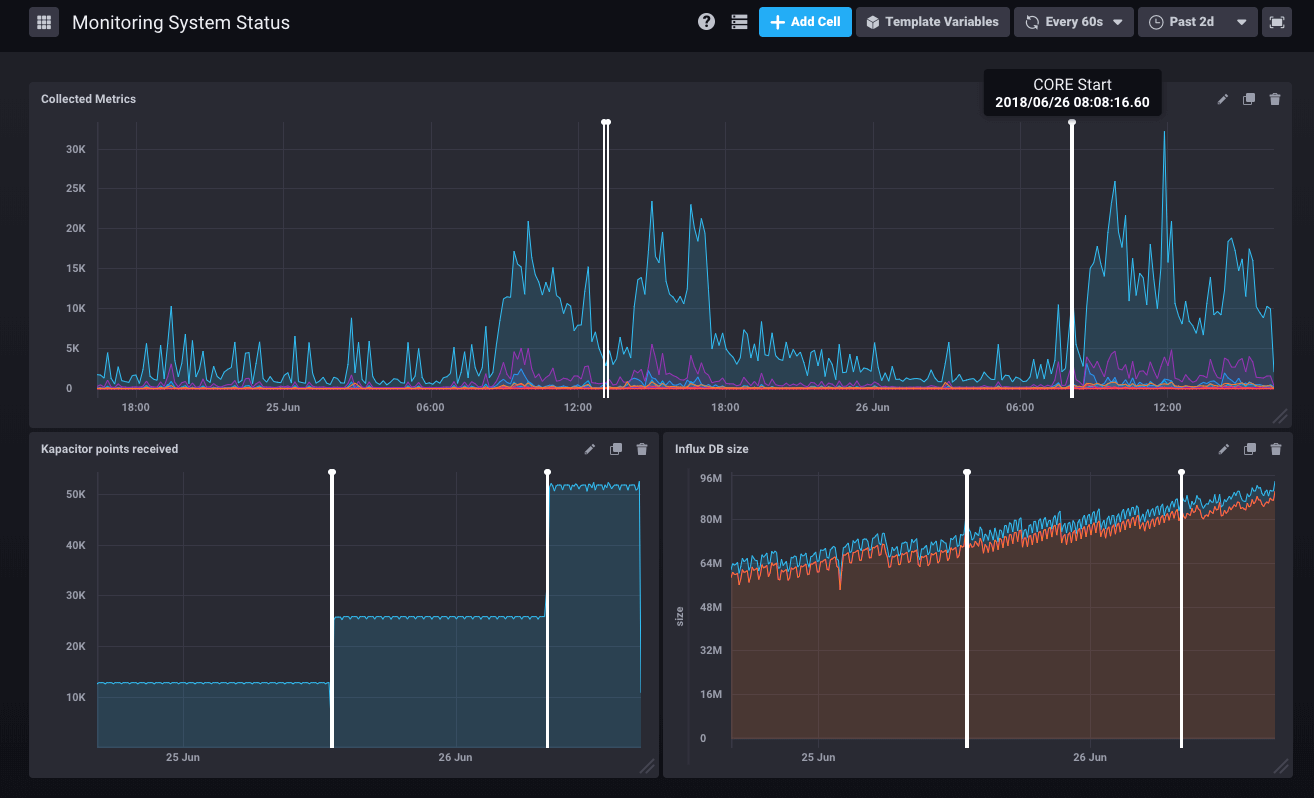
Dashboards!
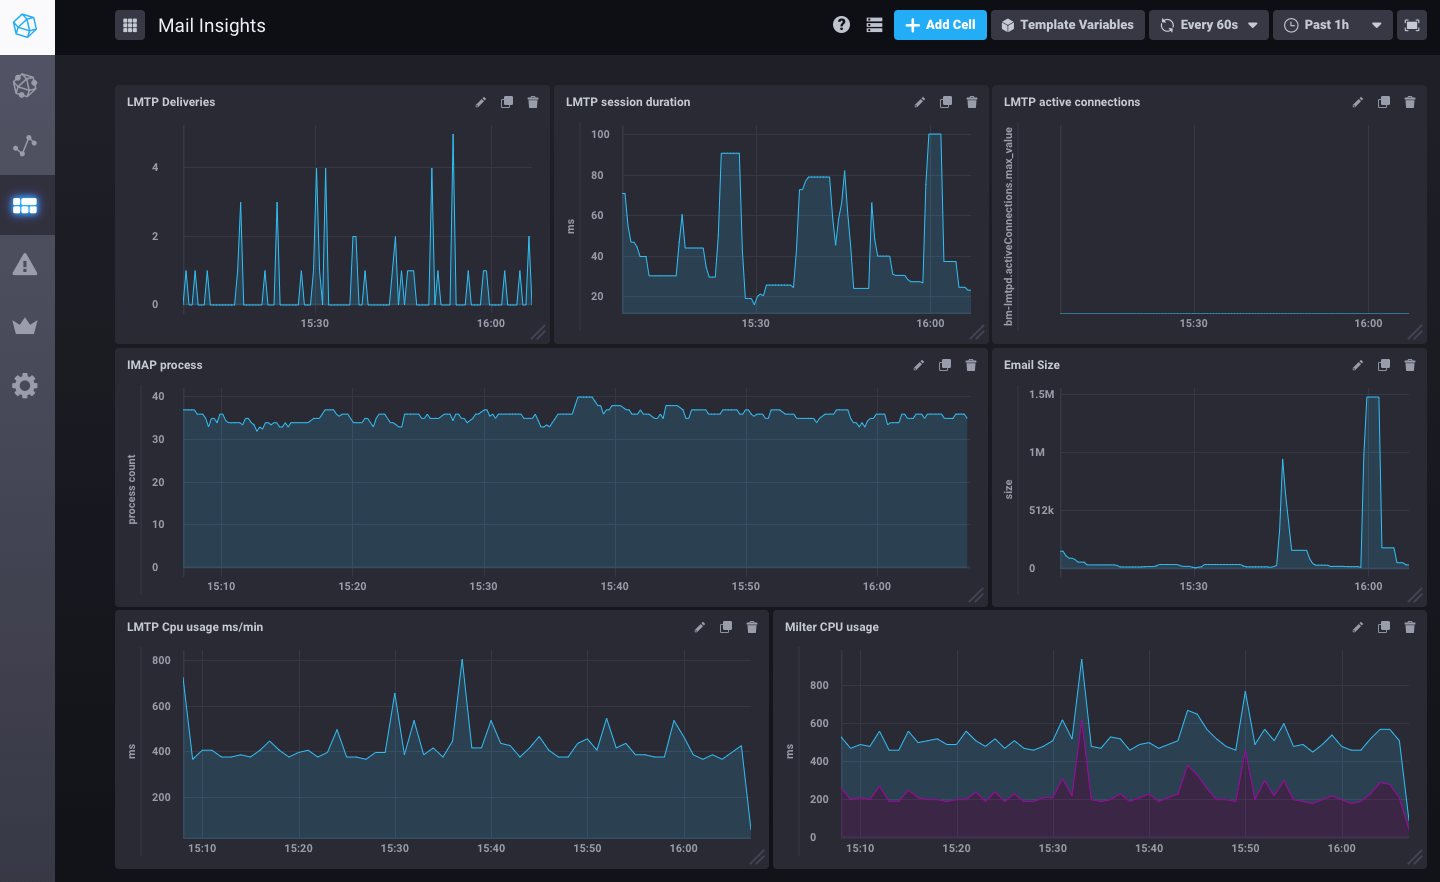
Here is an example of an email flow monitoring dashboard as it is pre-set in BlueMind 3.5.9.
But it can show many other metrics: system (disks, workload, network traffic), postgresql (QPS, shared buffers usage), nginx.
Data history is collected over 7 days, so no more mysteries on the hard disk that was still full 2 hours before an incident report.
Alerting
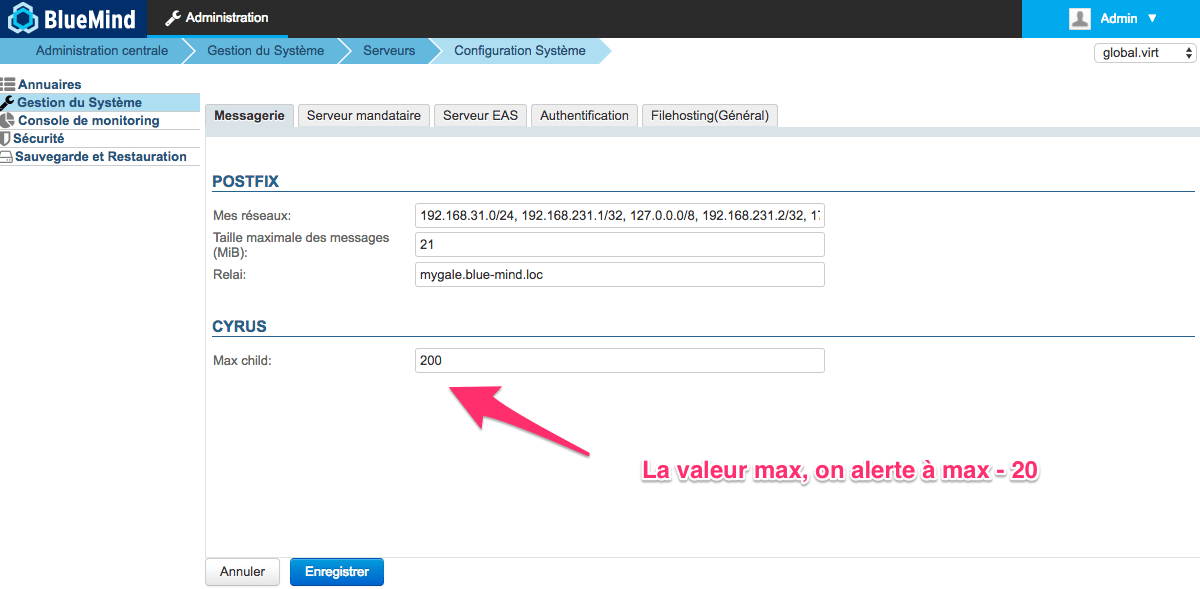
Knowing the number of active IMAP processes is good. Comparing it to the maximum set value is better.
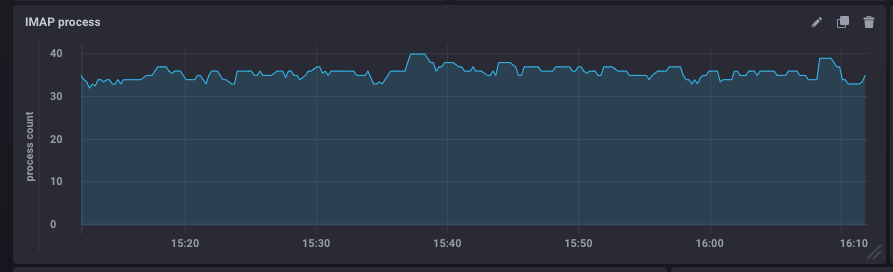
This metric is being monitored constantly by Kapacitor (the imap-connections script is configured by BlueMind) to compare the number of processes running at a given moment with the number set in BlueMind.
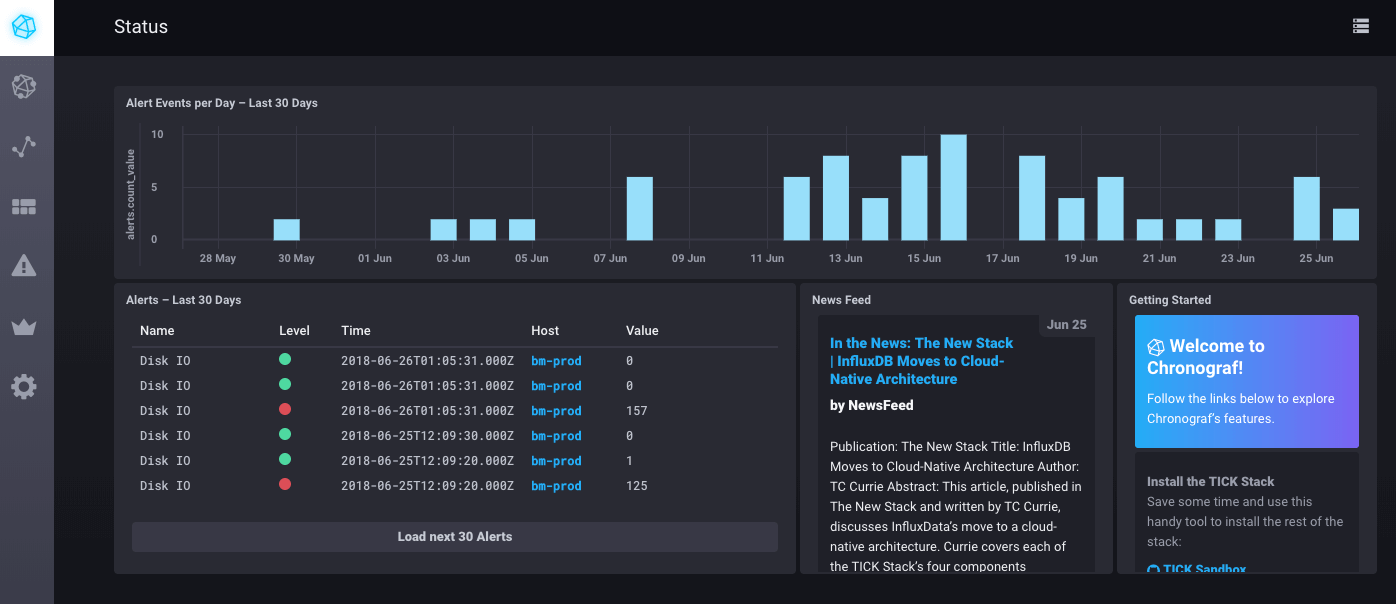
You can see these alerts on the monitoring/tick/ homepage of your BlueMind console using the installation wizard password.
Annotations
With alerts come annotations which signal points in time (or timeframes) on your graphs.
If an administrator restarts the Core, the monitoring system archives it and it is shown on all the graphs:

Programmed tasks running on your system are also shown on the graphs when they take longer than 30 seconds. That way it’s easy to diagnose when system slow-downs reported by users are caused by a backup or a directory import.
What’s next
BlueMind records a large number of metrics but not all are used in graphs or alerting scripts yet. Dashboards and alerting scripts can be added to BlueMind via plugins and future versions should bring new ones and offer “self-healing” features (when a given problem arises, the solution is known and therefore applied automatically).